

High-density laser scanners emit hundreds of thousands of non-visible light pulses per second. Pulses bounce off an object’s surface, and these reflections are detected by the scanner.
“Based on mathematical processes,” said Malte during his presentation, “the location of the reflection is stored as a point in three-dimensional space.”
This results in a “point cloud”. The point clouds generated by Malte and the team at Scion are beautiful, multi-coloured landscapes of forest vegetation, consisting of all vegetation layers, from forest floor to forest canopy.
“This can be a very quick and easy way to record huge datasets, which can be used to measure vegetation attributes like diameters or heights,” said Malte.
Using this tool to measure vegetation is just the beginning of its possible uses. For example, high-density laser scanning was used by Malte and the team to compare the structures of kauri forests in the Waitakere Ranges, a project that was completed under the Risk Assessment & Ecosystem Impacts research theme.
“We covered different development stages of kauri forests and also kauri dieback symptomatic and asymptomatic areas,”
Malte Cordes
To complete the scans, the team carried their scanner in a backpack. They walked a predefined grid to make sure they captured an in-depth picture of the vegetation. They covered an area of approximately 2000 square meters in less than one hour to produce a 3D image of each individual monitoring plot, a point cloud containing 450 million points equalling 5 GB of data.
Backpack scanning yielded efficient coverage from the ground to the treetops at all six kauri stands they surveyed. These images were used to assess and describe the forest structure at each site.
“Structure can be described by different metrics, which for example, address the height, openness and complexity of forest stands,” said Malte.
Malte investigated possible metrics that could be used to quantify differences between kauri stands with and without symptoms of kauri dieback. While he found four promising metrics, none could detect kauri dieback-induced changes in structure at a single point in time. However, these metrics were tested to be able to detect changes if scans were repeated at the same location at a second point in time.
“The data has huge potential for further analysis and creates a baseline for the following scans and other ecosystem monitoring activities,” said Malte.
Of specific interest is the ability of these scans to generate maps of individual trees. It is possible to link this data to other data sources, like field measurements or satellite images, to improve our understanding of individual tree health.
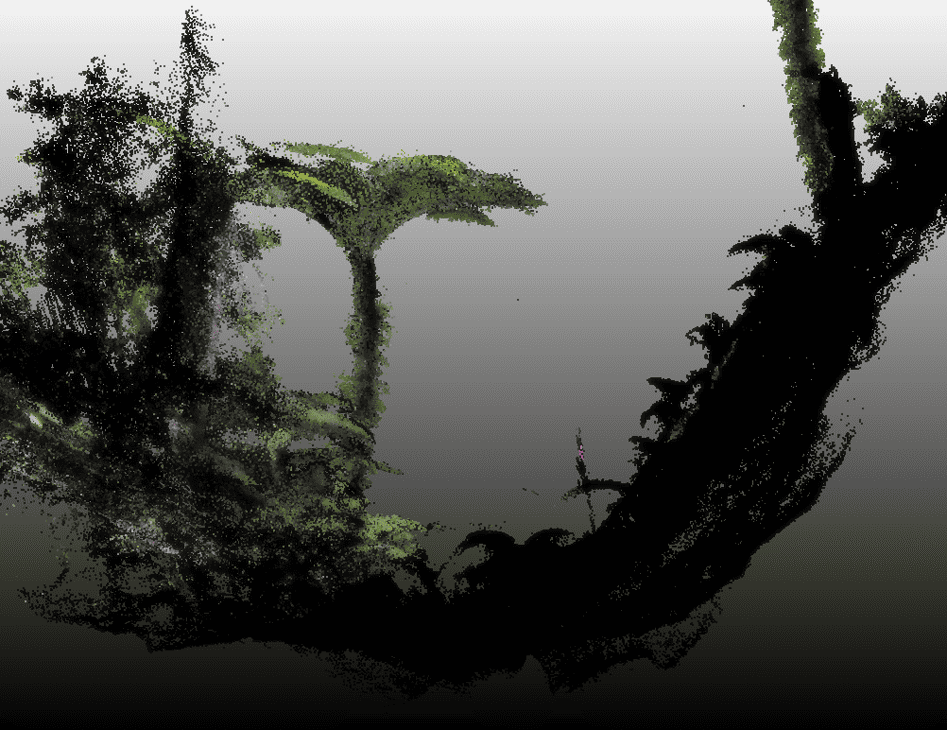
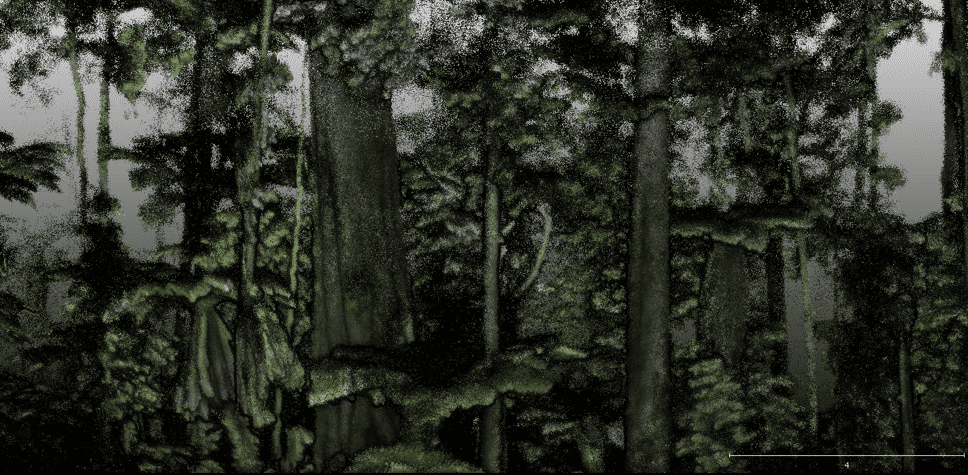
LiDAR scans of a dense, multi-layered North Island indigenous forest site. Images thanks to David Pont.
The team would like to acknowledge the support of Te Kawerau ā Maki for this work.
Listen to Malte’s full presentation at the Kaurilands Summit here.
Jenny Leonard