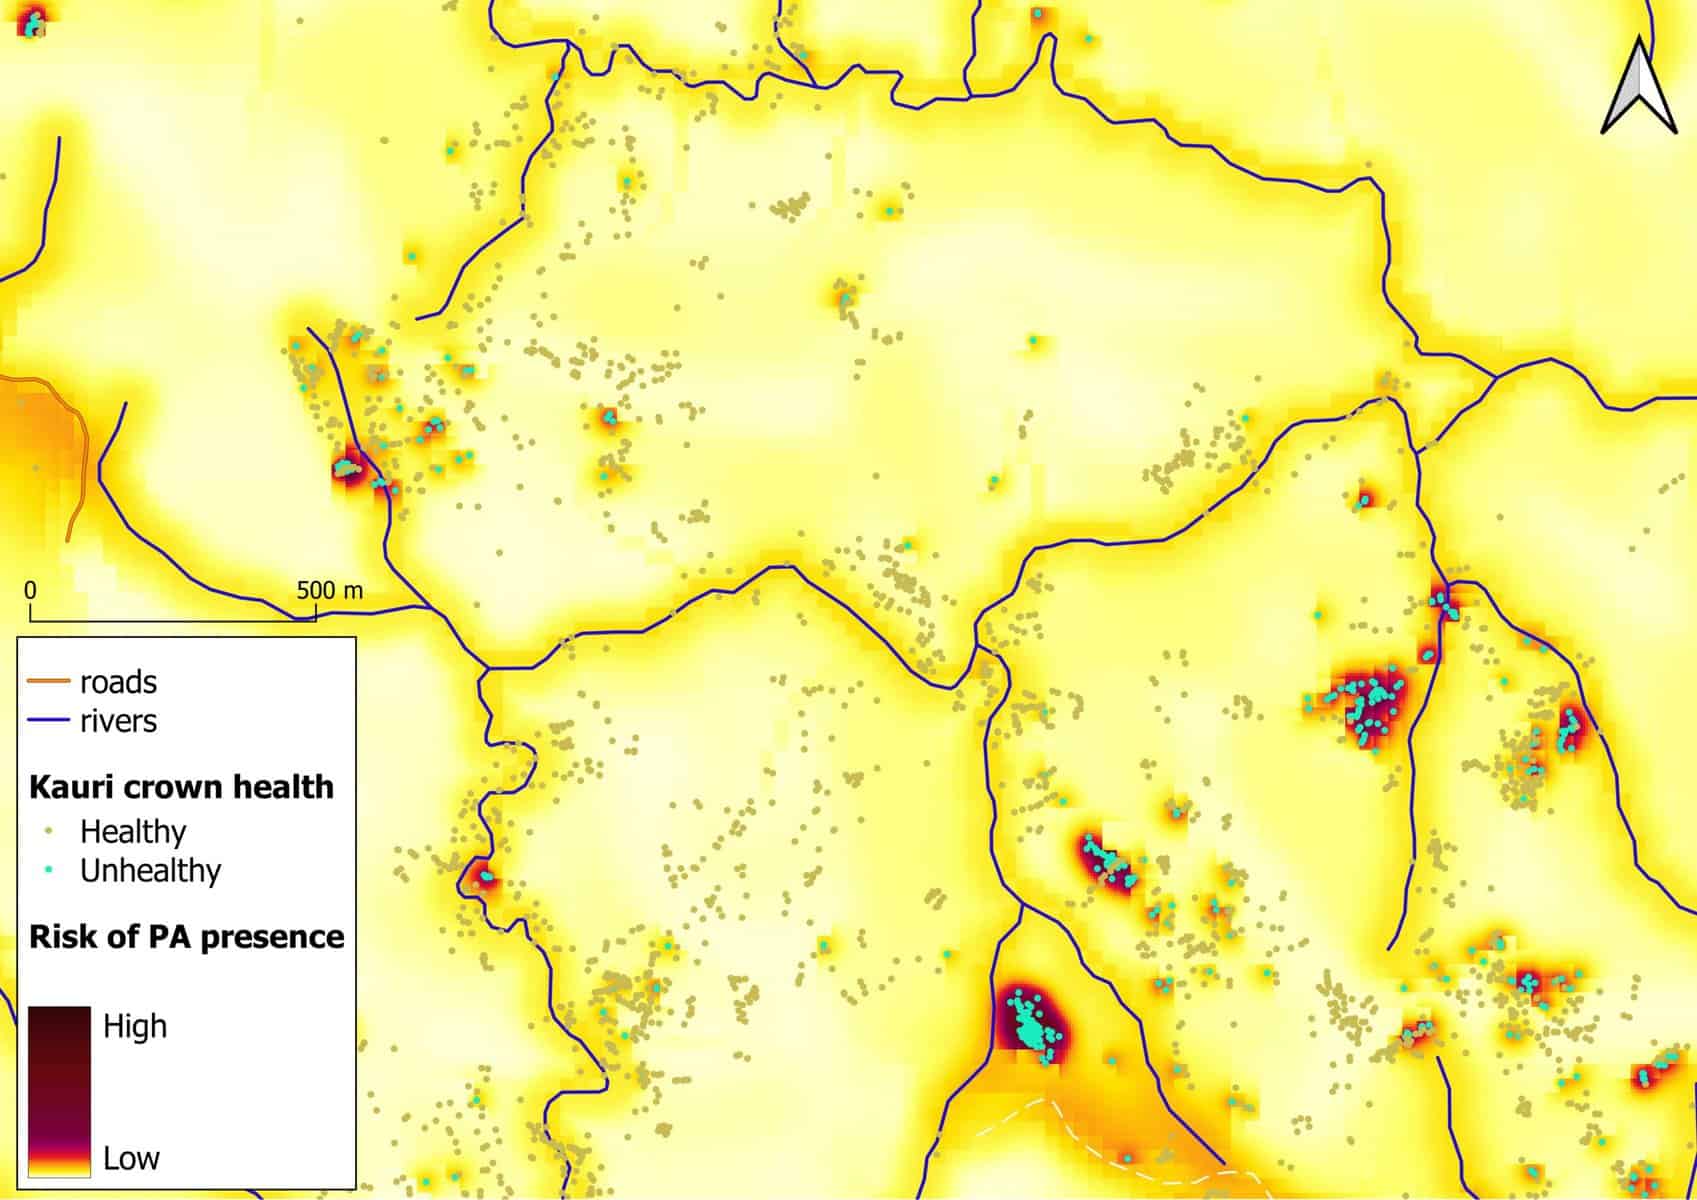
Over the native range of kauri, nobody is certain which areas contain Phytophthora agathidicida (PA), the pathogen that causes the disease kauri dieback, and which areas are pathogen-free. It is important to know where this pathogen is and where it isn’t so that kauri in good health can be protected and sites with infection can be managed to prevent further spread.
Gathering information about the spatial distribution of kauri dieback disease is a daunting task. Aerial surveillance has helped improve our understanding of disease distribution to a degree, especially where decline in the health of the canopy is visible from the sky. However, aerial data can only be gathered on New Zealand’s few clear days and is currently limited to obvious signs of dieback in mature tall trees that break through the canopy. Additionally, canopy health decline can be caused by other factors, such as drought and on-the-ground disturbance.
Ground surveillance is another important tool for gathering information on the extent of the disease. However, it is an expensive method that can be logistically difficult and environmentally risky.
“Ground surveillance is particularly difficult in topographically inaccessible areas,” says Cecilia Arienti-Latham, quantitative ecologist at Manaaki Whenua—Landcare Research in Lincoln and co-lead for the Integrated Surveillance theme. “Also, there is a risk of people spreading the disease through the landscape while completing ground surveillance.”
The Integrated Surveillance team recognised the need for a systematic way to look for the disease while reducing the labour required on the ground. The team sought to combine knowledge from experts, such as plant pathologists and modelers, to predict where this disease is most likely to occur. In this instance, they worked closely with members of Theme 6: Host, Pathogen and Environment.
“We wanted to develop a tool that used our understanding of PA biology and spread to help guide targeted, impactful surveillance efforts.”
Cecilia Arienti-Latham
Experts worked to define the relationships between the risk of pathogen presence and known environmental variables. For example, the natural spread of PA is focal (spreading through root-to-root contact and water transport) but it can also spread longer distances via human or animal vectors. As such, variables the team focused on included slope (since the pathogen is water borne, it has a tendency to “flow” downhill via natural water flow), distance from known infections (close proximity equates to higher risk), and distance from roads, tracks, trap lines and rivers (all of which are vectors in their own right).
This information was used to create “risk maps”. These maps show the location of kauri trees in an area with each risk variable layered on top. These maps are a useful way of visualising trees and determining whether they are located in areas of high or low risk of presence of PA.
NRT has been building risk maps for mana whenua groups in their network. The maps have helped mana whenua identify where to prioritise surveillance efforts, informed by local knowledge.
Cecilia and the team are now excited to be developing risk maps for even more areas for Tiakina Kauri. Tiakina Kauri, an agency within Biosecurity New Zealand (Ministry for Primary Industries), invests in key kauri protection activities across the natural range where kauri grow. They work in partnership with mana whenua and collaborating agencies like DOC, regional councils, and CRIs. Risk maps are being trialled in some areas where Tiakina Kauri is funding PA and kauri dieback disease surveillance.
“Their plan is to use these risk maps to engage with mana whenua groups and design plans for on-the-ground surveillance,” says Cecilia.
Uptake by Tiakina Kauri ensures that this tool has a use beyond the narrower scope of the NRT programme, expanding its usefulness to a much broader scale.
“It is great that Tiakina Kauri is interested in these risk maps because they are the ones that have the funds to extend it to all of Northland and beyond.”
Cecilia Arienti-Latham
The widespread use of risk maps would have a significant impact in the management of the disease.
“If a consistent approach is used across Kaurilands, across agencies and groups, this will make the data gathered by surveillance efforts more consistent and robust,” says Cecilia.
Consistent and robust data provide a solid foundation on which to base informed land management decisions. As a bonus, this data is key to the development of additional tools geared at aiding in disease surveillance, such as proof of absence modelling.
“Using statistics and robust surveillance data, we can calculate the probability that an area is free of PA given the surveillance effort conducted and the risks present,” says Cecilia.
Proof of absence modelling will give communities and land managers confidence as to whether the disease is present locally.
“Not finding evidence of the disease doesn’t mean it isn’t there,” says Cecilia. “You’d have to survey every tree to know for sure. However, with statistical modelling, you can be a lot more confident that it’s not there given that you didn’t find it.”
Jenny Leonard
